Transition Salt Spring - Electric Vehicle Group - Salt Spring Island Passenger Electric Vehicle Annual Estimates
INTRODUCTION
The SSI Climate Action Plan (CAP 2.0) was released in February, 2021 outlining 250 recommendations to address the climate crisis on our island. The Plan sets a target of reducing emissions of greenhouse gases (GHGs) on SSI by 50% from 2007 to 2030.
The Transition Salt Spring - Electric Vehicle (EV) group intends to monitor the contribution to this target arising from the transition from fossil-fuel vehicles to electric vehicles. In this report we are focusing on passenger vehicles.

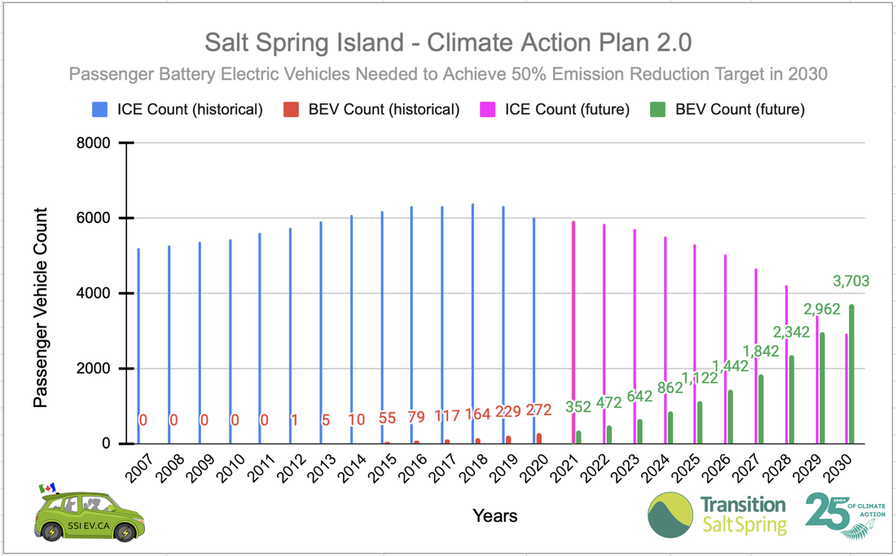
The chart above illustrates the growth of EVs and decline of ICE vehicles to date and a projected point at which the curves would need to cross. Currently, that represents an average annual increase of EV registrations on SSI of about 30% from 2020 to 2030. Note that it is anticipated that the total number of passenger vehicles will increase as SSI population increases.”
SUMMARY
- As of December 31, 2020, the zero emission passenger vehicles count is 272 representing an increase of 19 % over 2019
- Estimated reduction in GHG emissions is 680 tCO2e
- Estimated total gasoline/diesel supplies to SSI avoided is 290,000 litres
- Estimated oil and filter changes avoided ... 272
- Estimated 2020 fuel and service savings is $550,000 or about $2,000/vehicle
DEFINITIONS
ICE (Internal Combustion Engine) vehicles - run primarily on gasoline or diesel and require regular maintenance of oil levels and filters, exhaust systems and engine tuning. Considered as 100% contributing to GHG emissions.
BEV (Battery Electric Vehicles) - operated exclusively on electricity and are considered to have zero emissions. There is modest annual maintenance with only one cabin air filter and very few moving parts to wear out compared to ICE vehicles.
PHEV (Plug-in Hybrid Electric Vehicles) - operated with a combination of ICE and BEV. The BEV component typically accounts for roughly 40-50 km/per fuel cycle (full to close to empty). Because, travel destinations are in relatively close proximity on SSI, the BEV component is believed to be used more than in most other locations but the SSI PHEV count is not available. For our analysis, we consider PHEVs as contribution 100% to GHG emissions. PHEV's require regular maintenance similar to an ICE vehicle (Oil and filter changes, etc.).
Hybrid Vehicles (no plug) - utilize on an on-board battery that supplements motion at low speeds. The Provincial Government does not consider them an EV. We have considered this class to be essentially ICE vehicles.
Commercial Vehicles. Commercial vehicles (like Heavy Duty Trucks, Buses, Taxis and Trailers) are much more likely to drive further and use diesel fuel. They are not considered in our emissions report.

SCOPE
We have restricted our analysis to passenger vehicles, as that is the major form of on island road transportation with an alternate choice of fuel today. The estimate is based only on the operation of the vehicle. Other cradle-to-grave externalities including the building and the disposal of vehicles are beyond the scope of our estimate. Accordingly, we do not account for the emissions arising from related oil and gas exploration, refining, transmission and production or from the sources of electricity generation for EV charging. We intend to update the total GHG emission estimates on an annual basis or as needed.
THE ASSUMPTIONS
With such a challenging task, there have to be many assumptions made.
Vehicle count. On an annual basis, ICBC provides a data base of vehicles registered to folks on Salt Spring Island. Data from a given year, becomes available in the second quarter, the following year. At year end, 2020, ICBC reported 272 BEV passenger vehicles registered on SSI.
Note: This Report contains information licensed under ICBC's Open Data License. All analysis, information, opinions and conclusions drawn in this Report are those of the Authors, and do not reflect the opinions or policies of ICBC.
Replacement Factor: Every EV owner is assumed to have chosen a BEV instead of an ICE vehicle.
Distance Travelled: From 2017 - 2018, we undertook a survey of EV Owners. We determined that the average Salt Spring Island EV owner drives about 9,600 km per year. We have rounded that number to 10,000 km/year.
Fuel Economy: ICE fuel economy changes each year depending on the makes and models available. In each year we derived averages for the relevant classes of vehicles. For example, in 2020, we used 10.69 litres per 100km (Natural Resources Canada: Fuel Consumption Ratings Open Government Portal).
Greenhouse Gas (GHG) Emissions: GHG emissions change each year depending on the makes and models available. In each year we derived averages for the relevant classes of vehicles. For example, in 2020, we used 251 gCO2e/km (Natural Resources Canada: Fuel Consumption Ratings Open Government Portal) .

PROGRESS ON MEETING TARGET EMISSION REDUCTIONS BY 2030
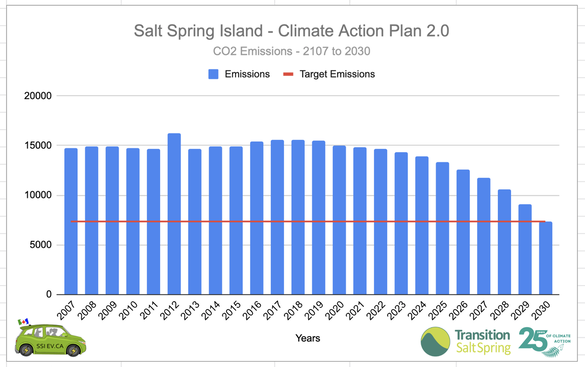
The SSI CAP 2.0 reports 2007 emissions of 14,700 tCO2e for passenger vehicles only. This gives us a target of about 7,300 tCO2e by 2030.
Good progress has been made in the past decade to lower our island emissions but continued, significant growth is essential if we are to meet or exceed our target. At year-end 2020, 272 BEVs were registered, representing 4.5 % of all passenger vehicles.
The chart above illustrates the possible decline of emissions which would achieve the 2030 target.
Our cumulative emissions reduced to date is estimated at: 2,321 tCO2e
This Report Prepared by the Transition Salt Spring - EV Group (December, 2021)
