SSI EV Ownership - a Progress Report (August, 2022)
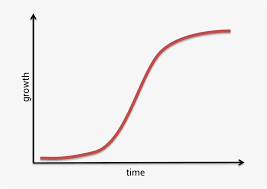
As early as 1996, a business Entrepreneur, Tony Seba, predicted that the adoption of fully electric vehicles would be a disruptive technology. That they would catch business analysts by surprise, with an S curve rather than straight line adoption. What is an S curve for EV’s? For the first few years, there is a gradual increase with the early adopters. Then, as the word gets out of the benefits of electric driving, the purchase rate accelerates, even exponentially as the purchase of gas and diesel vehicles declines. Finally, there is market saturation, rate of interest peaks and the sales curve flattens out. The S curve has been seen from the adoption of radial tires to cell phones. See diagram below:
On Salt Spring Island, with our environmental mindset, we were early adopters (starting in 2012), and in 2020, we discovered we had the highest passenger car EV ownership (by population) of any local community in BC. But with only 2.2% of the passenger vehicle ownership, we were yet to enter the steeper mid-section of the S curve and still had a long way to go to reach a 2030 objective of 50% reduction in passenger vehicle emissions since 2007.
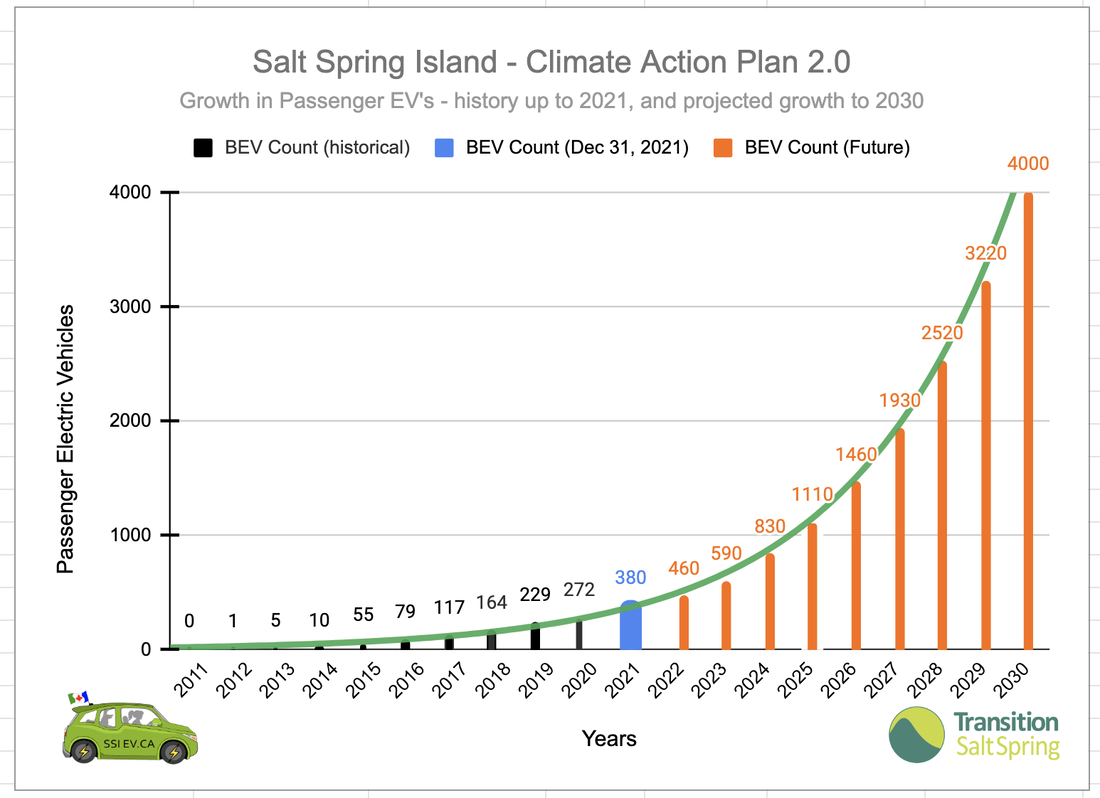
Where are we now ? By referencing the ICBCs Open Data License Report of vehicle ownership statistics for 2021 Salt Spring increased EV ownership by 108 cars to a total of 380. That 380 total represents a growth rate of almost 40% over 2020 and guess what, after some analysis, we believe we are still the highest EV passenger vehicle ownership (by population) of any region in BC. As of the end of 2021, EV’s represent over 5.4% of all passenger vehicles on SSI, and that is a lot of quiet driving, inexpensive fill ups and cleaner air. And that was with a pandemic, supply chain issues and dealers having very little inventory to meet the increasing demand. Without these business challenges, the ownership number would have certainly been much higher. Now there are long wait lists at the dealers, used units are very difficult to find and are holding their value.
Based on this trend which confirms we are entering the steeper part of the S curve adoption, if the vehicles can arrive at the dealers, we should see even a greater percentage of purchases in 2022 and in future years The chart below shows our passenger EV vehicle count to the end of December, 2021 and projections to meet our 2030 objective.
We are confident that our accelerating EV adoption will ensure we are on track to achieve the CAP 2.0 emission reduction goal of at least 50% by 2030 over those in 2007 for passenger vehicles. The EV Group is continuing to access reliable and consistent databases and methodologies and will report emission reductions as we crunch the numbers. We plan to include the emerging growth of commercial vehicles in our count next year.

